Category: Supply Chain & Geopolitics

English analysis of critical minerals policy, trade controls, and supply-chain risk.

  • Japan–South Korea Rare Earth Cooperation: A Structural Supply Chain Axis Taking Shape

    Japan–South Korea Rare Earth Cooperation: A Structural Supply Chain Axis Taking Shape

    Japan and South Korea are moving toward a more structured rare earth relationship built around supply security, industrial continuity, and allied coordination with Australia. The substantive change is not a single treaty or headline project; it is the emergence of a supply-chain axis linking Japanese policy finance, Australian upstream and midstream capacity, and South Korean magnet and manufacturing demand. For critical minerals planning, that is more consequential than isolated announcements because it strengthens multiple links in the chain at once.

    • Japan’s rare earth strategy remains anchored in JOGMEC, which links financing, stockpiling, overseas participation, and offtake support.
    • South Korea’s role is centered on NdFeB magnet manufacturing and downstream industrial demand rather than domestic mining.
    • Lynas and the Kalgoorlie processing route give the Japan-Australia-Korea framework a physical non-Chinese supply backbone.
    • The immediate risk remains concentration in separation, heavy rare earths, and magnet qualification, even as diversification broadens.
    • Key signals to monitor include additional offtake structures, heavy rare earth processing progress, and any expansion of Korean magnet capacity.

    Why this matters now

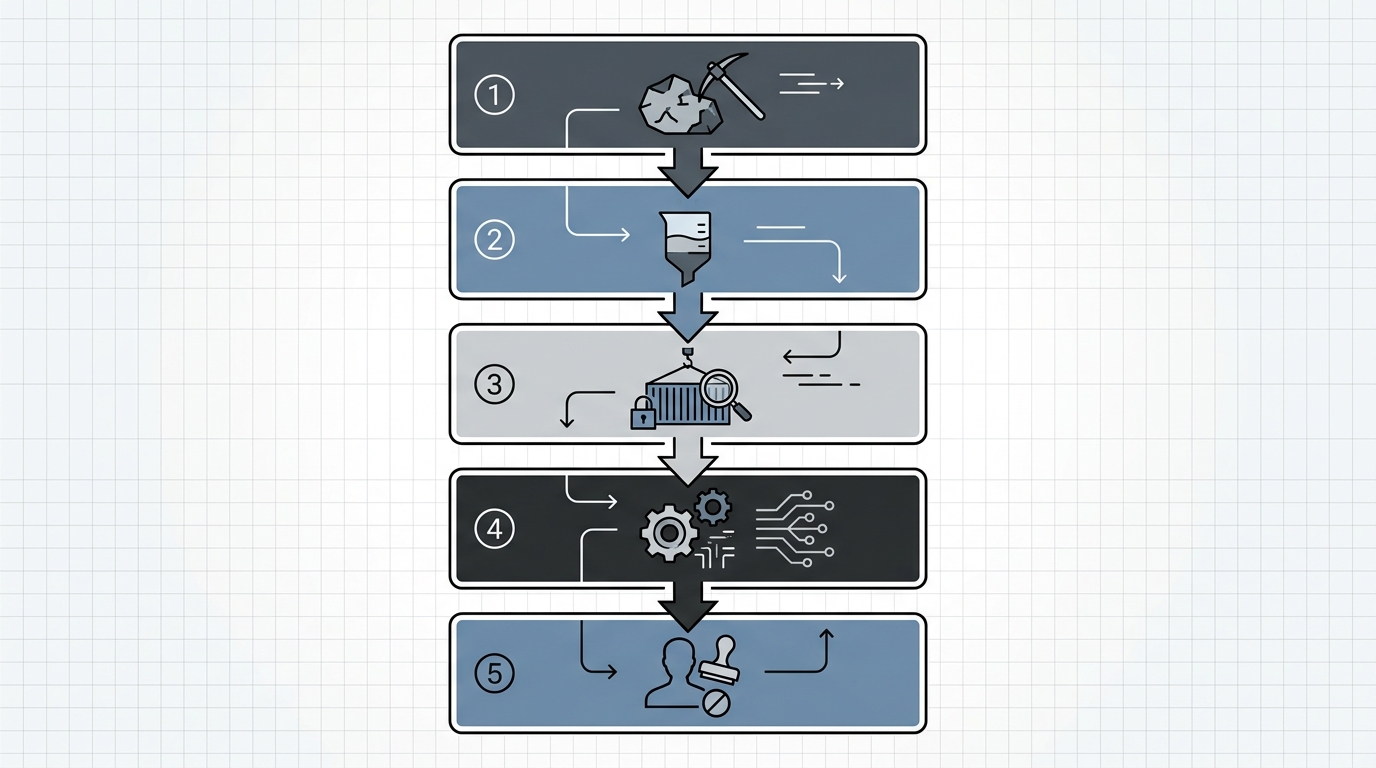
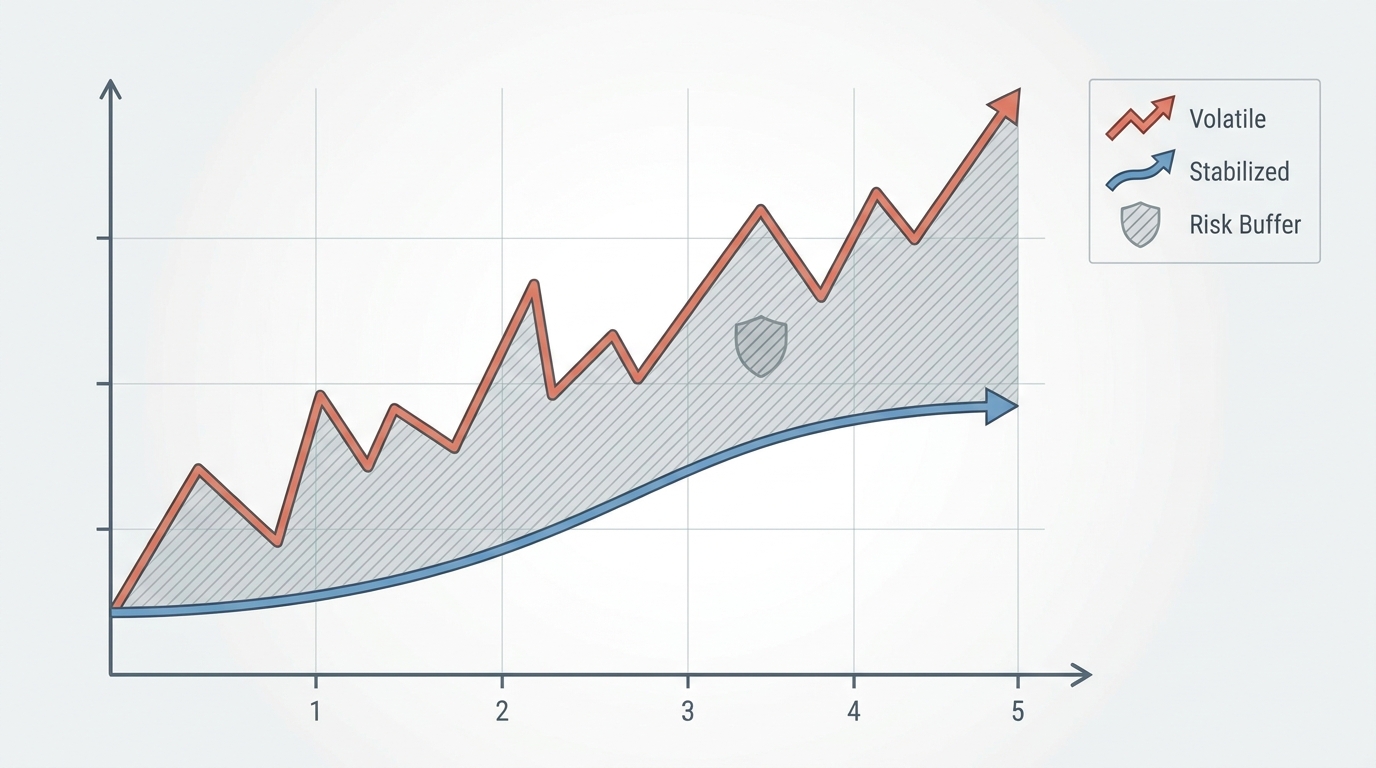
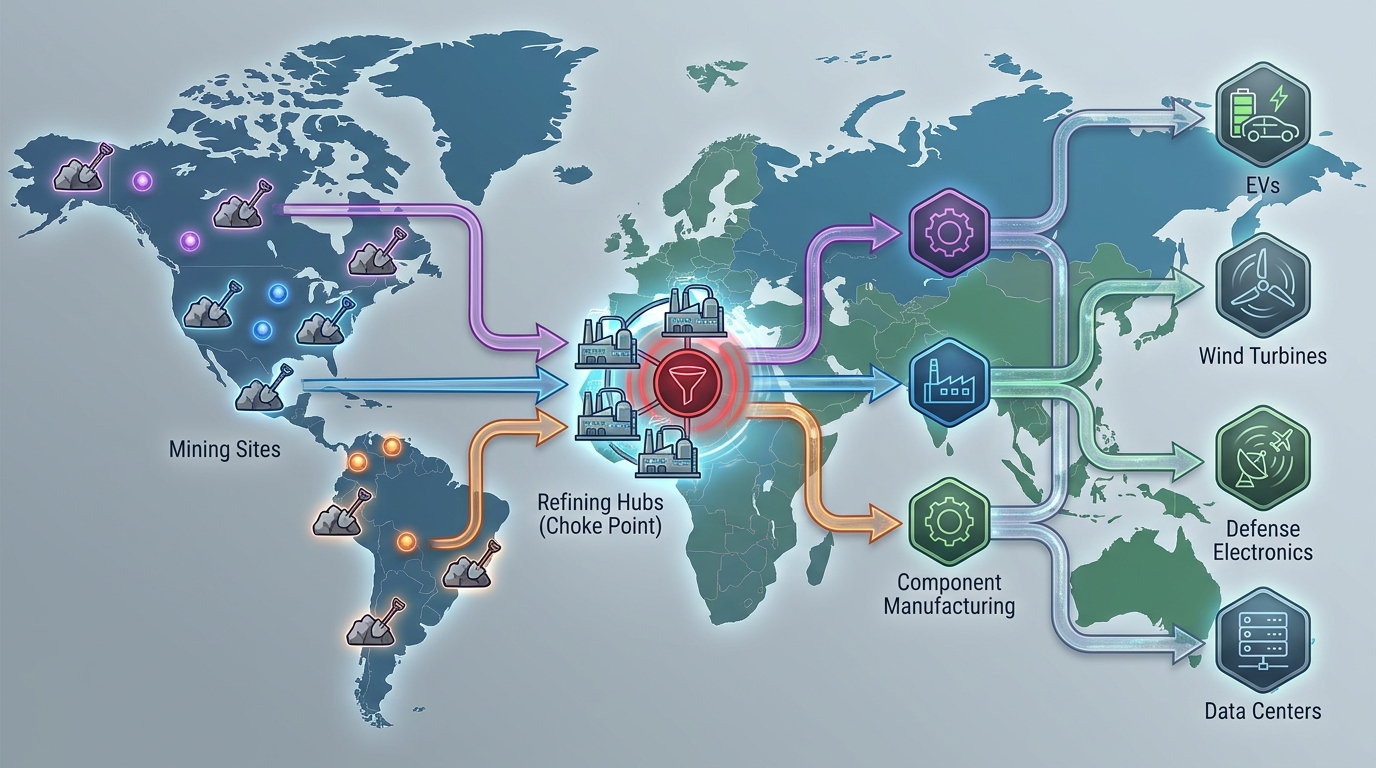
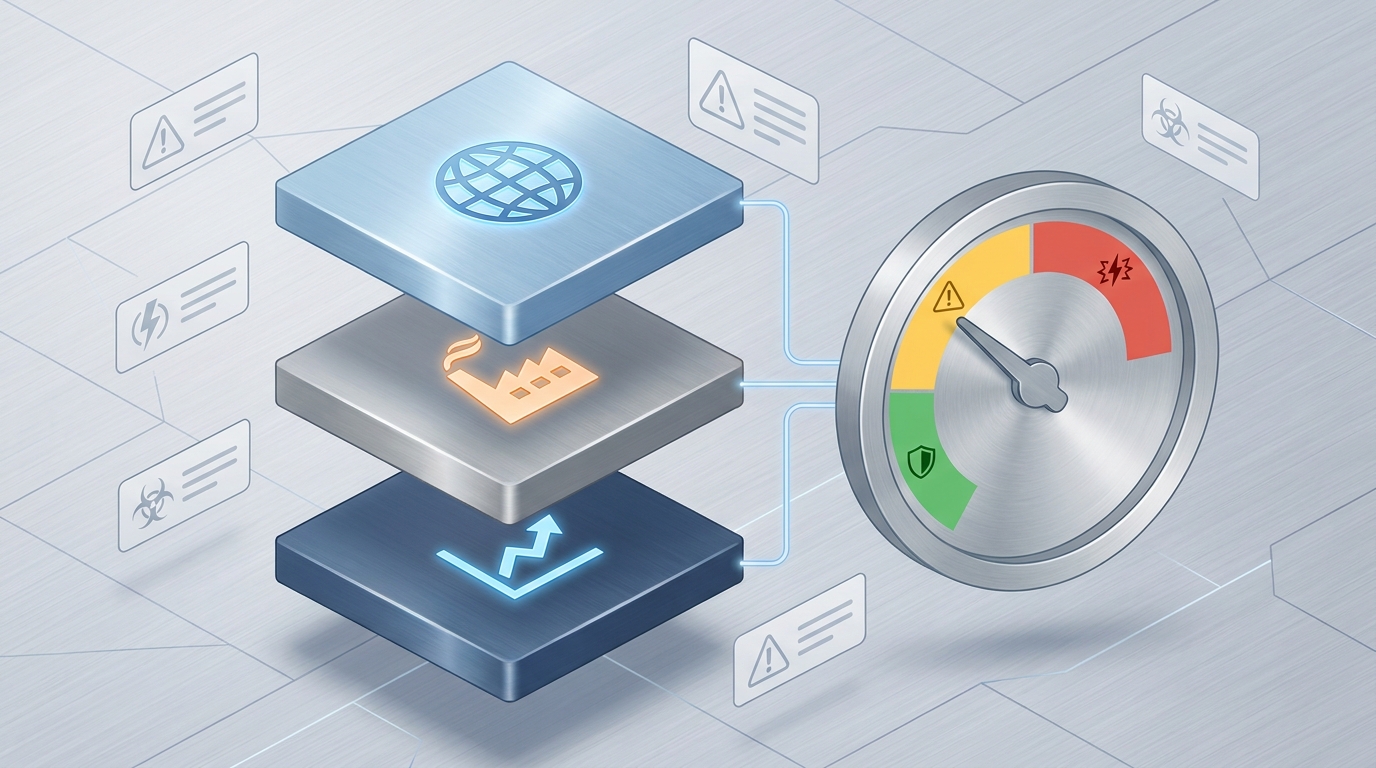
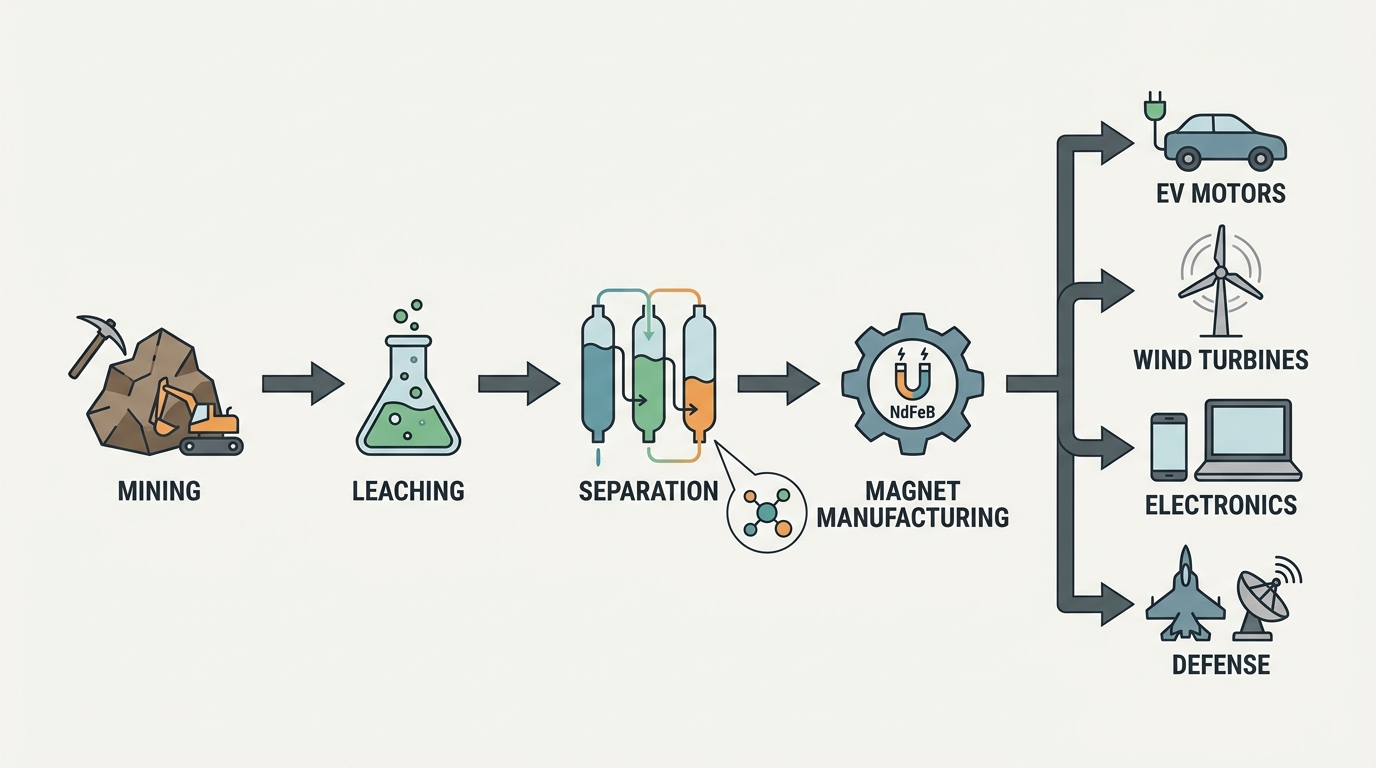
    Rare earth security is often framed as a mine supply problem. In practice, the harder issue is continuity from ore to separated oxides, metals, alloys, magnets, and qualified industrial components. Japan and South Korea occupy different positions in that chain, but those positions are increasingly complementary. Japan has the more established state-backed model for de-risking supply. South Korea has dense manufacturing exposure in motors, electronics, batteries, automotive systems, and other magnet-intensive sectors. Australia contributes the most credible allied upstream base through Lynas and related processing infrastructure.

    This creates a structural pattern rather than a symbolic partnership. Japan reduces project risk and anchors non-Chinese supply through institutional tools. Korea provides sustained downstream pull and magnet relevance. Australia provides material flow outside Chinese control. The result does not replace China, and no such claim is supported by the available material, but it does reduce fragility in the most sensitive part of the supply chain.

    JOGMEC’s model: why Japan remains the policy anchor

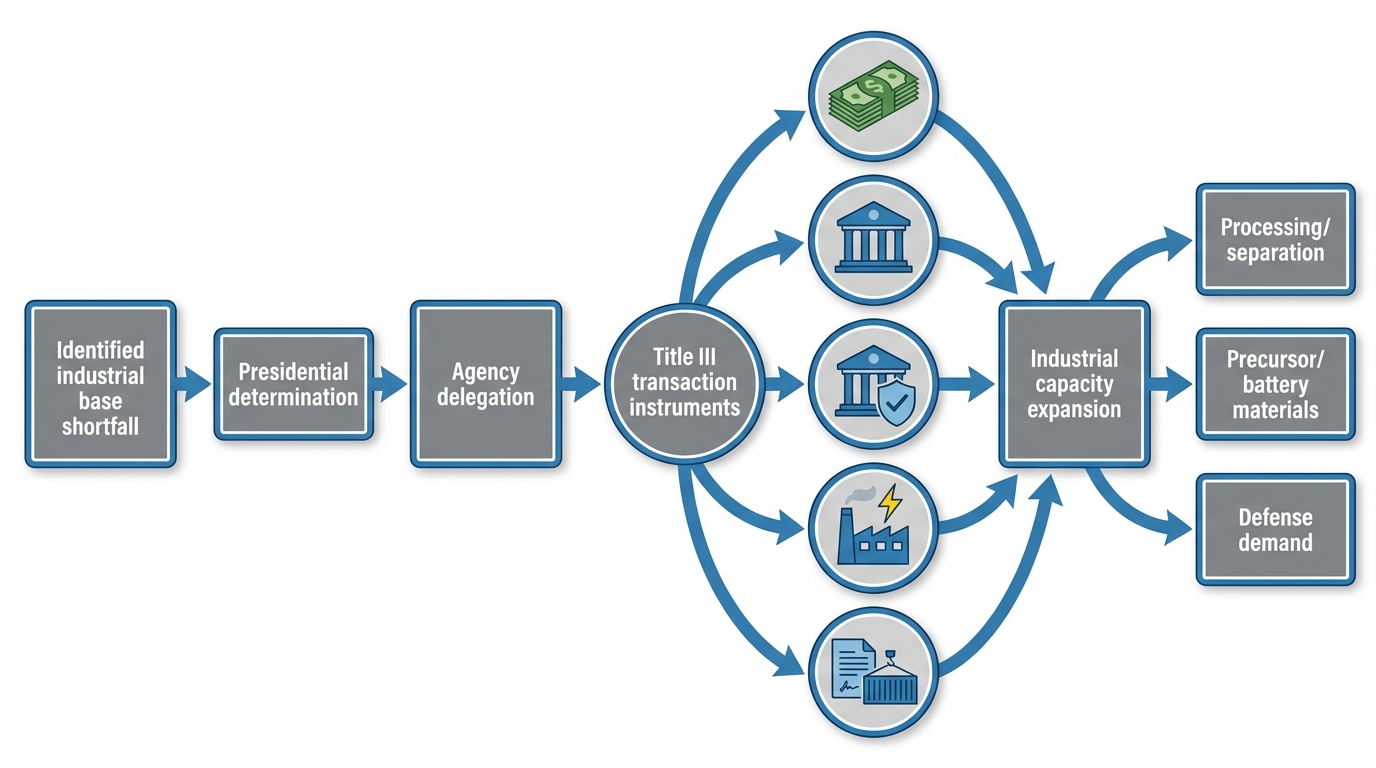
    The core of the japan rare earth model is JOGMEC, the Japan Organization for Metals and Energy Security. Its significance lies in institutional design. Rare earth projects are difficult to finance through normal commercial logic because they face long development periods, technical complexity, concentrated processing, and geopolitical risk. JOGMEC addresses that gap through a mix of financing support, overseas project participation, stockpiling, and supply-chain resilience measures.

    That framework became especially important after the 2010 rare earth shock, when Japan treated supply dependence as a strategic vulnerability rather than a routine procurement issue. The lasting lesson was that offtake and financing are linked. Long-term security depends less on opportunistic spot buying than on institutional commitments that make alternative supply chains bankable. This is why jogmec rare earth policy is often treated as a model: it spans upstream mining, processing, strategic inventories, and industrial continuity rather than focusing on one segment alone.

    Conceptual visualization of the non-Chinese rare earth processing and logistics link (mining/separation to shipping).
    Conceptual visualization of the non-Chinese rare earth processing and logistics link (mining/separation to shipping).

    For Japan-South Korea cooperation, this matters because the Japanese side already has an operating policy mechanism. The bilateral pattern is therefore not starting from zero. It is extending a Japanese architecture into a wider allied network that can include Australian production and Korean downstream conversion.

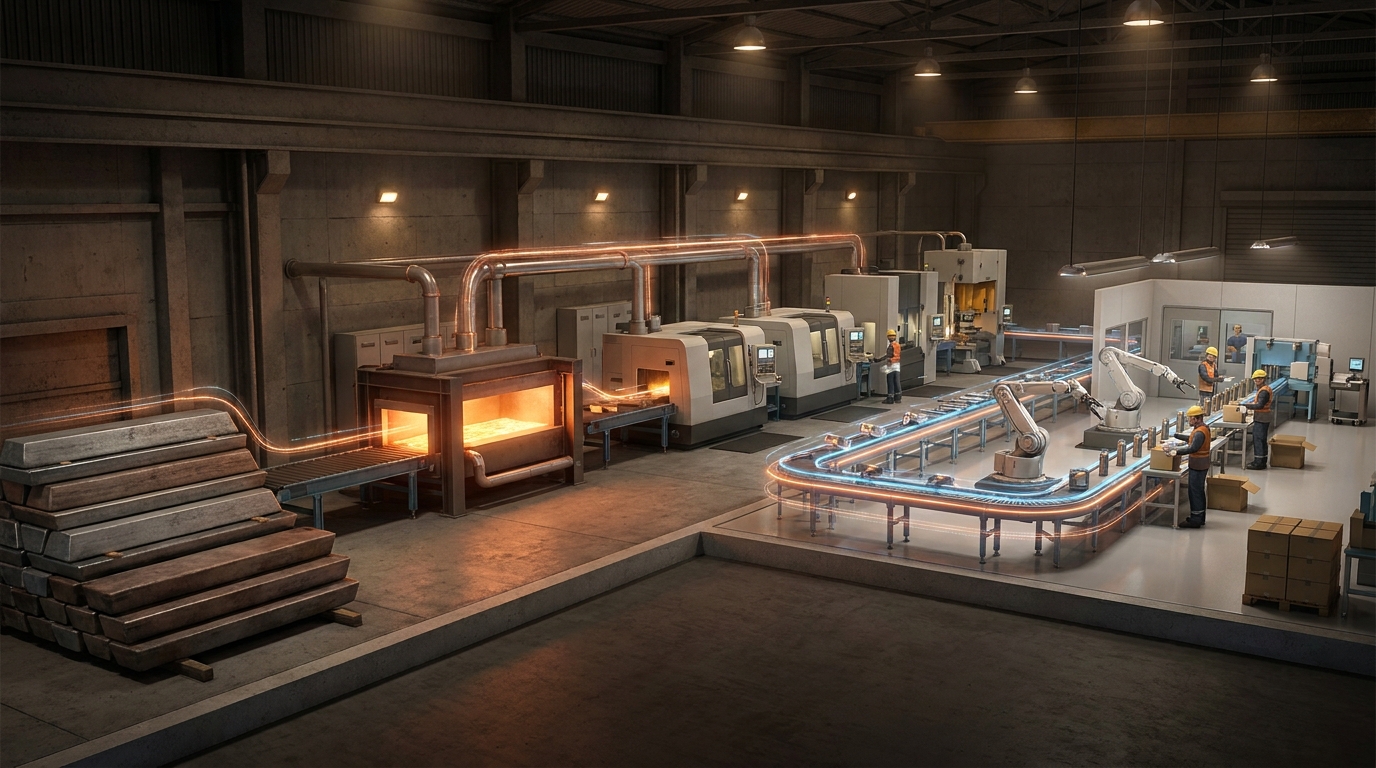
    South Korea’s role: the magnet and manufacturing node

    South Korea is often described mainly as exposed to rare earth disruption. That description is incomplete. Its strategic importance lies in manufacturing density and in the role of korea rare earth magnets, especially NdFeB magnets. NdFeB is the highest-performance commercial permanent magnet family and is essential across electric drive systems, robotics, industrial automation, storage devices, and defense-adjacent applications.

    The available material does not provide a verified figure for Korean NdFeB magnet capacity, so a precise capacity estimate is not specified in the elements provided. Even without a published number here, the structural point is clear: South Korea is not only a buyer of rare earth inputs. It is a conversion and integration base where magnetic materials become qualified components for larger industrial systems. That gives Korea importance at the middle and downstream stages of the chain, where substitution is difficult and qualification cycles can be long.

    This is where japan korea critical minerals cooperation becomes practical. Japan brings policy finance, established diversification experience, and materials expertise. Korea brings high-volume industrial pull and a major manufacturing platform. Those strengths are different, but they reinforce each other.

    Supply-chain architecture: financing + separation + magnet fabrication + industrial demand.
    Supply-chain architecture: financing + separation + magnet fabrication + industrial demand.

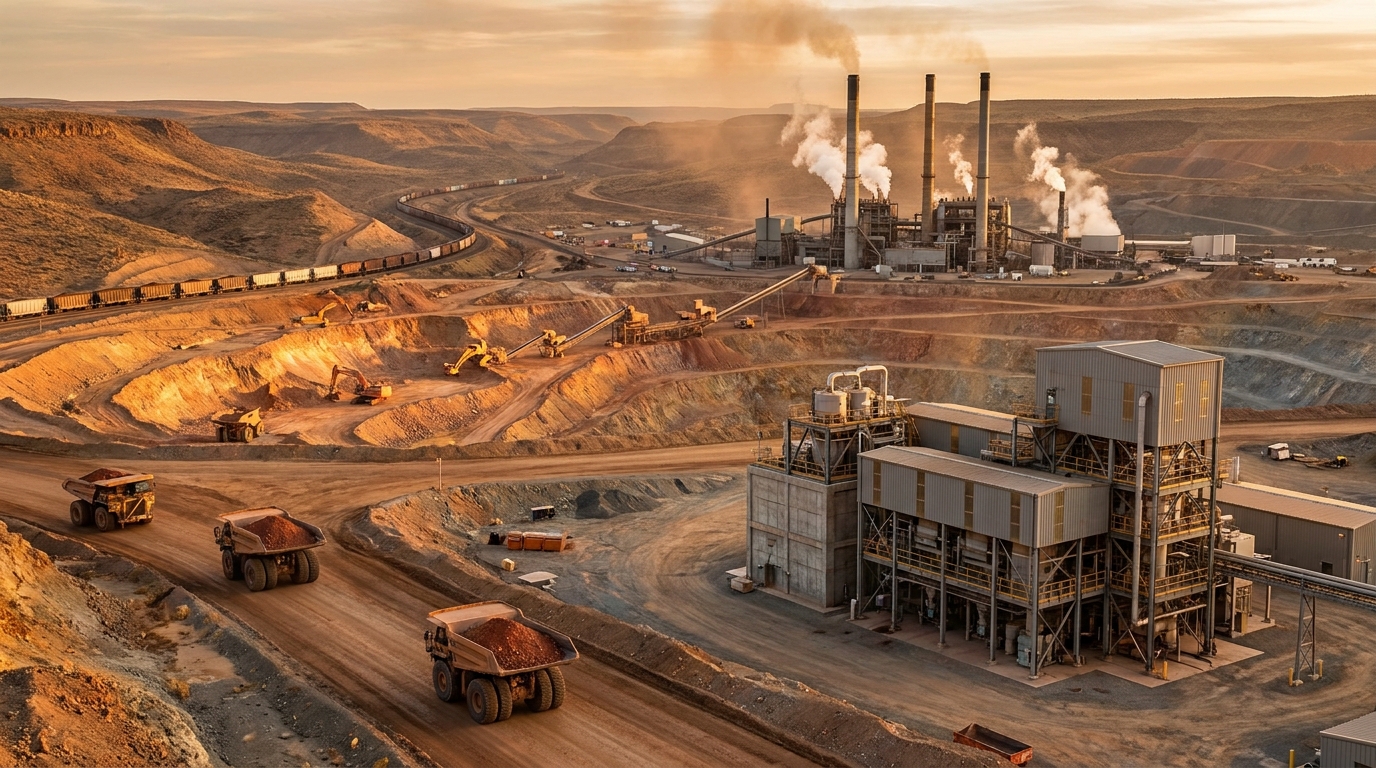
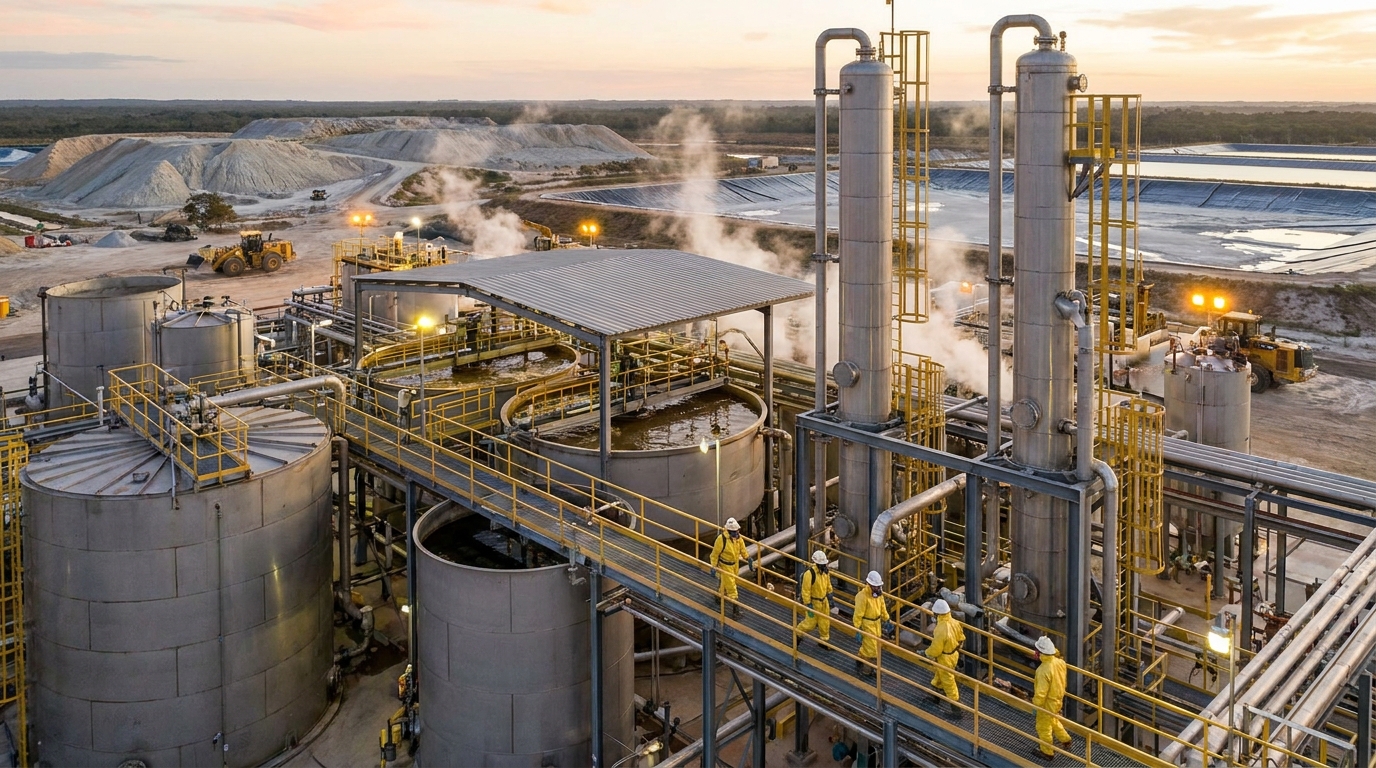
    Lynas, Kalgoorlie, and the Australia link

    The third pillar is Australia, particularly Lynas. In non-Chinese rare earth supply chains, lynas japan ties are important because they show how Japanese demand, policy support, and Australian production have been connected over time. The critical point is not only mining at Mount Weld but also the processing route that includes Kalgoorlie. Kalgoorlie matters because it shifts part of the value chain closer to the mine and supports a more diversified refining architecture.

    This has implications beyond Japan. A functioning Kalgoorlie-linked corridor improves the credibility of non-Chinese supply for regional manufacturers, including Korean magnet and component producers. It also highlights the logic of trilateral alignment: Australia provides material, Japan helps underwrite continuity, and Korea can absorb qualified output into industrial production.

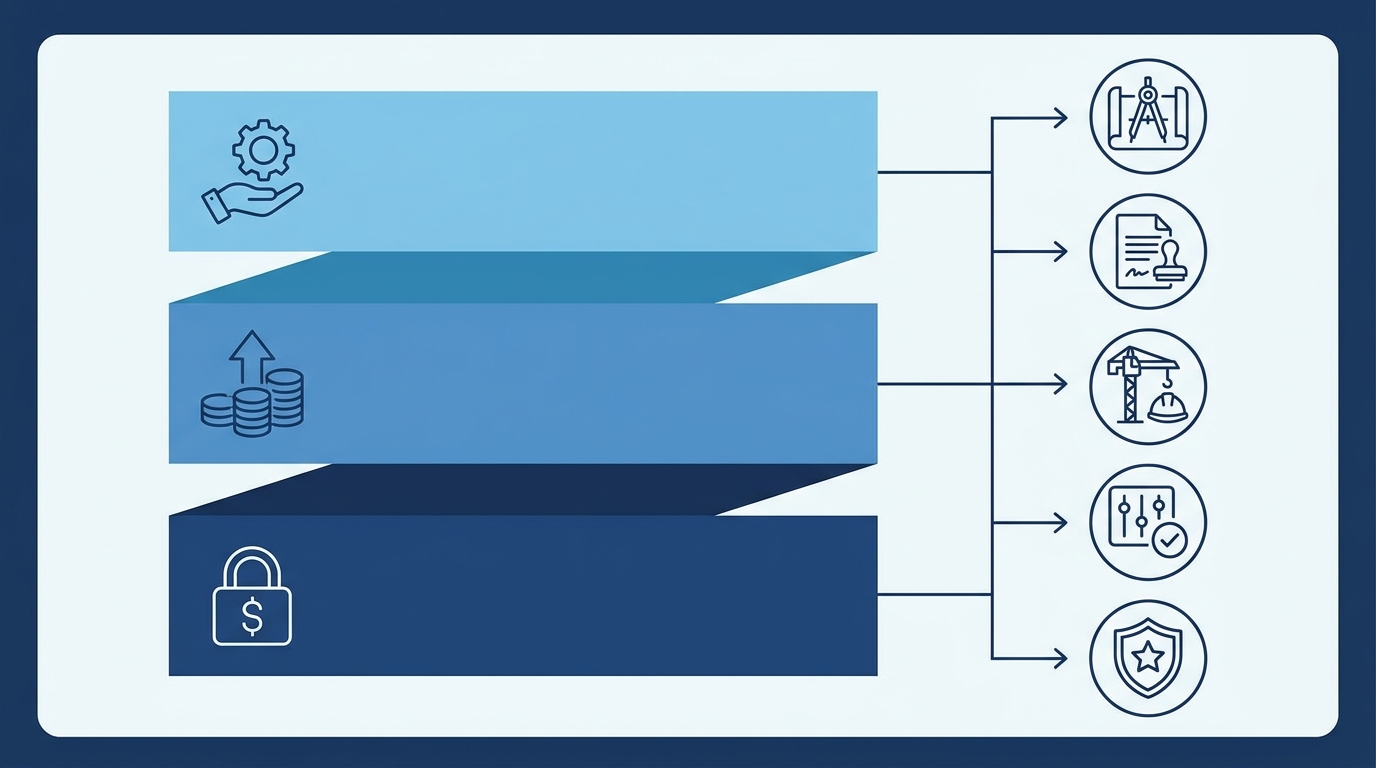
    What defines the structural cooperation pattern

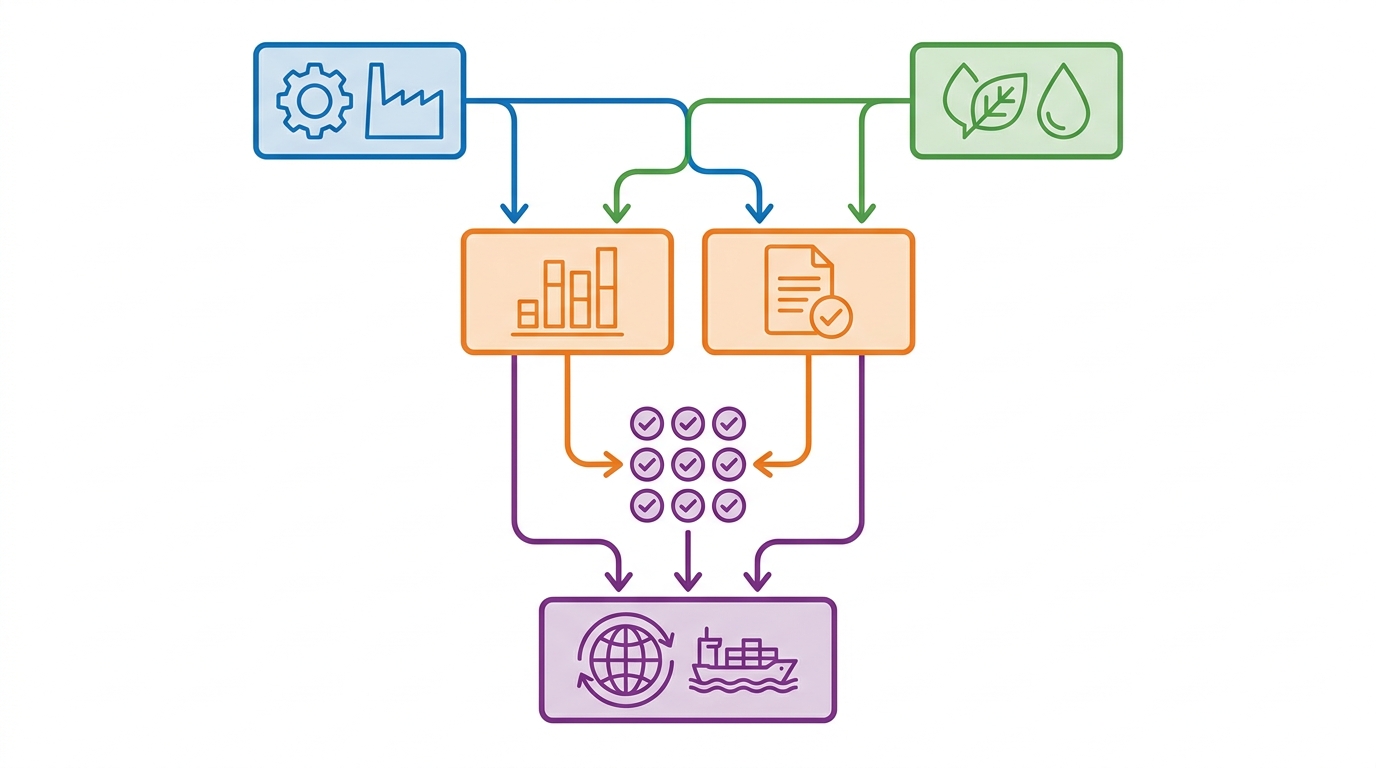
    Four elements define the emerging axis. First, supply security is being built through long-term structures, not episodic market access. Second, policy covers the full chain, from resource access to processing and stockpiles. Third, the arrangement is alliance-compatible without requiring identical institutions in each country. Fourth, the operational goal is continuity of qualified material into manufacturing, not symbolic diversification alone.

    That pattern is under-covered because most rare earth reporting still centers on export controls or bilateral diplomatic rhetoric. For industrial and policy audiences, the more relevant question is whether a non-Chinese chain can stay technically viable and commercially continuous. Japan-South Korea cooperation is significant precisely because it addresses that question through functionally different but connected roles.

    Downstream magnet manufacturing and quality/qualification environment.
    Downstream magnet manufacturing and quality/qualification environment.

    Risks and signals to watch

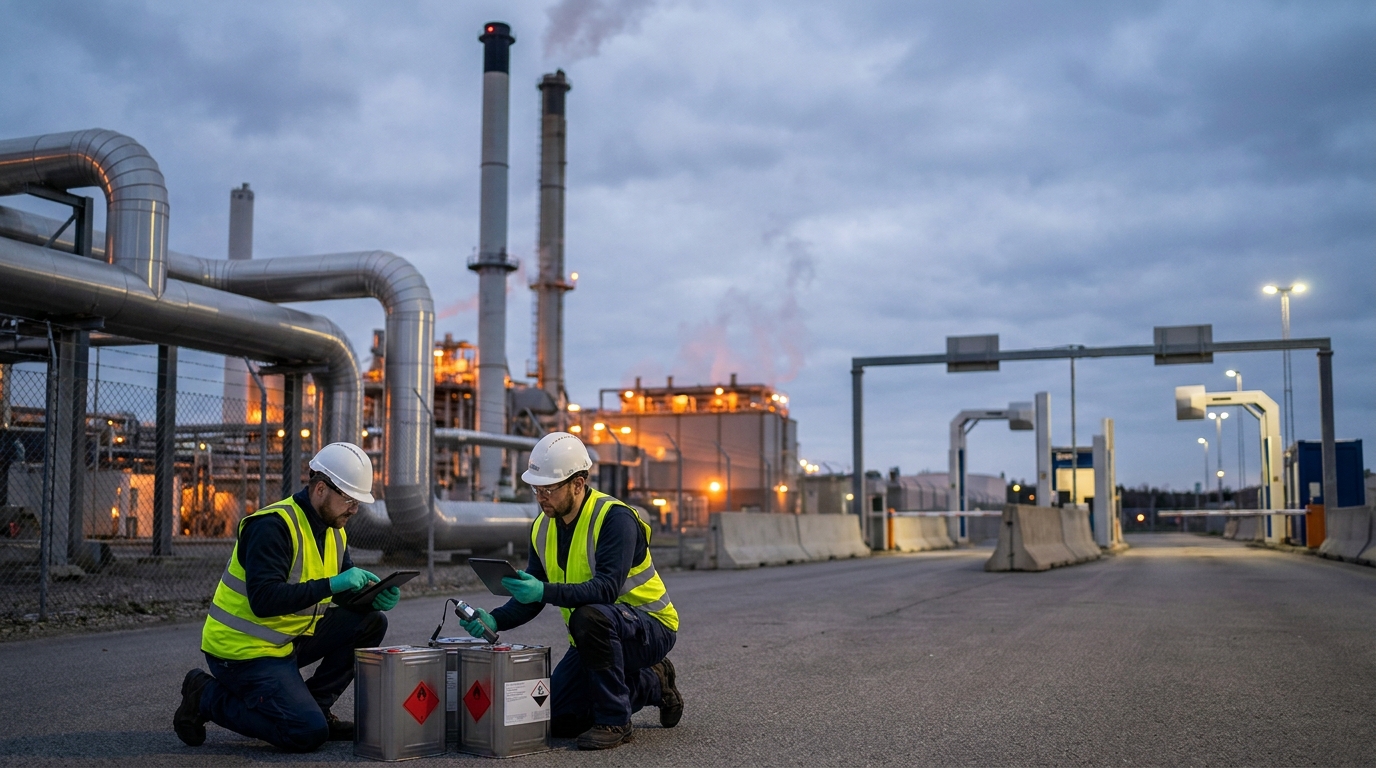
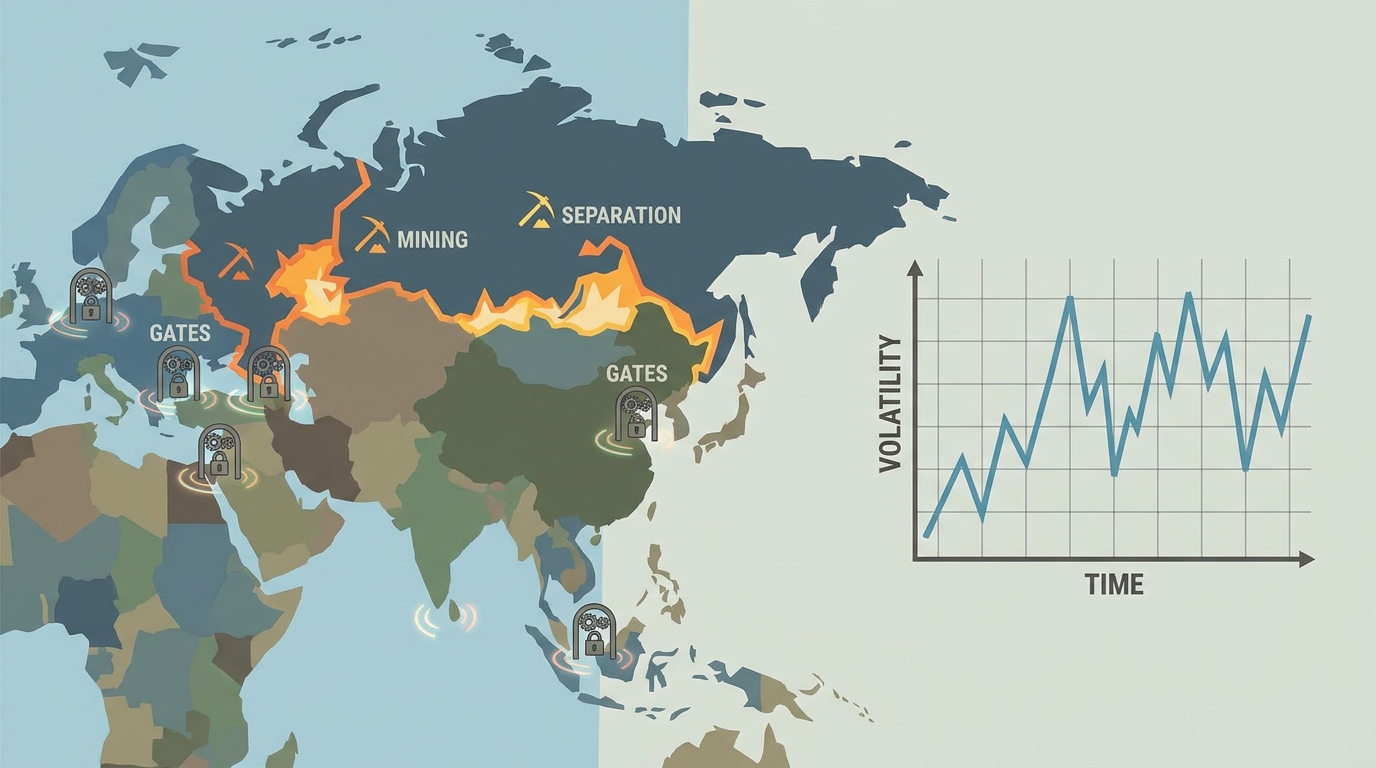
    The main constraint remains concentration in separation, heavy rare earth processing, and magnet-grade qualification. A broader allied chain still faces execution risk if one stage remains too narrow or too slow. ESG and compliance scrutiny also remain relevant, particularly where traceability, processing jurisdiction, and defense-linked end uses intersect. None of those risks disappear simply because diversification improves.

    Signals that would confirm further consolidation of this axis include additional JOGMEC-supported supply arrangements, clearer evidence of Korean NdFeB capacity expansion, deeper Lynas-linked processing integration, and more explicit coordination around stockpiles or downstream materials. Signals of stress would include delays in processing scale-up, bottlenecks in heavy rare earth availability, or disruptions that force a return to more concentrated sourcing.

    The central takeaway is straightforward. Japan and South Korea are no longer best understood as separate rare earth cases. They are increasingly part of a structural supply-chain axis in which Japanese policy finance, Korean manufacturing capability, and Australian upstream supply reinforce one another. For critical minerals strategy, that is a material shift in how resilience is being built across the region.

  • China Rare Earth Export Quota Framework: What MIIT and MNR Actually Control

    China Rare Earth Export Quota Framework: What MIIT and MNR Actually Control

    China’s rare earth regime is often described as an export ban. That framing is incomplete. The substantive market change over the past decade has been the shift from a simple trade-restriction narrative to a layered control system covering mining, separation, approved producers, export licensing, and selected technology transfers.

    For supply chains, the central point is straightforward: the china rare earth export quota is not a single blanket ceiling on all outbound rare earth material. The system works first as a domestic production-allocation mechanism and only then interacts with export controls, customs procedures, and product-specific restrictions. That distinction matters because disruption can occur even without a formal ban if upstream output, processing, or documentation falls outside approved channels.

    Key Takeaways

    • China’s rare earth controls operate through multiple layers: production quotas, approved producer lists, export licensing, and technology controls.
    • MIIT and MNR sit at the core of the system: MIIT on industrial administration and quota oversight, MNR on resource governance and upstream mining control.
    • The quota regime primarily governs how much approved firms may mine and separate, not a universal export ceiling across every rare earth product.
    • The sector is concentrated in a small group of large state-linked rare earth producers, which limits the number of compliant supply nodes.
    • Market risk is shaped less by the term “ban” than by product scope, producer status, licensing documentation, and end-use scrutiny.

    What the quota system actually is

    The best way to understand China rare earth control is to separate domestic production quotas from export controls. Since 2010, China has used quota mechanisms to regulate how much rare earth material can be mined and how much can be separated by approved firms. These quotas function as an administrative allocation tool rather than a market-balancing instrument.

    In practice, the regime is designed to influence four things: legal output, industrial concentration, environmental and resource oversight, and compliance visibility across the supply chain. This means the system controls who may produce, how much approved material enters the legal market, and how traceable that material is once it moves toward export.

    What it does not do is impose one identical rule across all rare earth oxides, metals, alloys, magnets, and related technologies. It also does not mean every shipment is automatically prohibited. Export eligibility depends on the product category, the producer, the exporter, and the applicable licensing pathway.

    MIIT and MNR: the two key authorities

    The requested distinction between MIIT and MNR is essential to understanding the mechanism.

    • MIIT, the Ministry of Industry and Information Technology, is central to industrial administration of the rare earth sector. Its role is tied to production oversight, processing governance, and quota-related industrial policy.
    • MNR, the Ministry of Natural Resources, sits on the resource side of the system. Its role relates to upstream resource governance, mining administration, and the control environment around extraction rights and geological resource management.

    This dual structure shows why the regime is broader than customs enforcement. Rare earth control in China begins at the mine and separation stage, not at the port. A firm may have technical capability to produce rare earth material but remain excluded from lawful output if it is outside the approved quota and resource-governance framework.

    Layered control stack from mining to end-use compliance.
    Layered control stack from mining to end-use compliance.

    Who receives quotas

    The quota system is concentrated among a limited group of large state-linked producers. The exact producer roster can evolve, but the structural point is stable: China has long favored a small SOE-centered producer universe rather than broad distribution of quota rights across many independent firms.

    That concentration has two direct supply-chain effects. First, it reduces the number of legal and scalable upstream supply nodes. Second, it makes traceability and compliance heavily dependent on the documentation and internal governance of a relatively small set of groups and affiliated production assets. In operational terms, the approved producer list is itself a control lever.

    How the regime evolved since 2010

    The modern system became globally visible in 2010, when China’s rare earth restrictions became a major trade and geopolitical issue. From that point, the regime developed beyond a narrow export story into a broader industrial-management framework.

    Operational nodes where administrative controls can introduce bottlenecks.
    Operational nodes where administrative controls can introduce bottlenecks.

    During the 2010s, quotas and consolidation were used to discipline a fragmented sector that had been associated with smuggling, uneven environmental performance, and weak control over production. The state response was to centralize the industry, tighten lawful production channels, and anchor supply within a smaller number of major groups.

    More recently, the framework has been layered with additional controls affecting technology, product categories, and export documentation. This matters because market participants often treat every rare earth announcement as if it referred to the same legal instrument. In reality, one measure may concern mining and separation quotas, another may concern export licensing, and another may concern technology transfer or end-use restrictions. These tools are related but not interchangeable.

    What the quota does and does not constrain

    The quota system constrains permitted production. It sets the legal boundaries for mining and separation by approved firms. That affects availability of upstream feedstock for downstream processors and exporters.

    It also constrains market structure. Because only a narrow producer group operates inside the approved framework, the quota regime shapes industrial concentration as much as physical output.

    Institutional roles and concentration of approved actors.
    Institutional roles and concentration of approved actors.

    It indirectly constrains exports, because export licensing sits downstream of lawful production. If upstream material is not produced through approved channels, export compliance becomes far more difficult. This is why the phrase rare earth export ban can mislead. In many cases, the practical barrier is not a universal prohibition but the interaction between producer eligibility, product classification, and licensing documentation.

    What the regime does not constrain in a uniform way is every product at every point in the value chain. Ore, oxides, metals, magnets, and technologies are not always treated identically. The market effect therefore depends on where the restriction is applied: mining, separation, export paperwork, or technology transfer.

    Why this matters for supply chains

    For downstream industry, the significance of the miit rare earth quota lies in execution risk rather than headline language. A shipment can be delayed by upstream quota status, producer affiliation, incomplete licensing, or added scrutiny around end use. This is especially relevant for sectors with low substitution flexibility, including magnets for automotive systems, aerospace components, electronics, and industrial equipment.

    The broader lesson is that China rare earth policy functions as a structural governance system. It is not just an export switch that is either on or off. It combines resource administration, industrial concentration, production allocation, export review, and selected technology controls. That combination explains why supply risk can intensify even when no new blanket prohibition is announced and why the approved producer base remains one of the most important indicators in the entire rare earth chain.

  • DPA Title III Critical Minerals Funding: How the Pentagon’s Industrial Base Tool Actually Works

    DPA Title III Critical Minerals Funding: How the Pentagon’s Industrial Base Tool Actually Works

    DPA Title III has become a core U.S. mechanism for expanding critical minerals capacity where commercial markets alone have not delivered sufficient domestic or allied supply. The substantive shift is not simply more public funding; it is the use of a national security statute to support mining, processing, separation, refining, and magnet or battery-material capacity through tailored financial instruments rather than standard procurement alone.

    For policy and institutional readers, the significance is structural. Title III is designed to address industrial shortfalls that affect defense readiness and supply-chain resilience. In critical minerals, that usually means support for bottleneck stages of the value chain, especially midstream processing, where the United States has often remained dependent on foreign capacity even when upstream resources exist.

    Key Takeaways

    • DPA Title III is a legal authority under the Defense Production Act used to expand industrial capacity tied to national defense, including critical minerals and related processing.
    • The program can use grants, loans, loan guarantees, purchase commitments, and direct capital support depending on the project structure and the identified supply shortfall.
    • Publicly announced awards show a clear emphasis on downstream and midstream bottlenecks such as rare earth processing, magnets, and battery materials, not only mine development.
    • DoD stated that since mid-2023 it awarded a total of $250 million to twelve recipients using IRA-appropriated funds through the DPA Purchases office for strategic and critical materials tied to battery supply chains.
    • The main execution signals to monitor are permitting progress, construction milestones, qualification of output, compliance conditions, and whether supported projects secure durable non-federal commercial demand.

    What DPA Title III Is

    Title III of the Defense Production Act is the part of the statute focused on domestic industrial base expansion. It is meant for situations where a material, component, or capability is considered important to national defense and the private market is not supplying enough capacity, fast enough, or in the required form. That makes it particularly relevant to critical minerals, where long project lead times, high capital intensity, difficult qualification processes, and concentrated foreign processing can leave major supply gaps unresolved for years.

    In practical terms, Title III is not a conventional purchasing program for finished goods. It is an industrial policy tool that allows the U.S. government, usually through the Department of Defense, to support new capacity creation. The emphasis is often on building or scaling facilities that can convert raw materials into defense-usable products.

    Legal Authority and Trigger Conditions

    The legal foundation matters because Title III is not an open-ended subsidy program. Its use is tied to a formal determination that an industrial shortfall exists and that government action is necessary to create, maintain, protect, expand, or restore domestic industrial base capabilities essential for national defense. Authority can be delegated to the Secretary of Defense and implemented through the offices responsible for DPA Purchases and related industrial base programs.

    This framework gives the Pentagon flexibility, but it also imposes discipline. Support is supposed to be linked to a defined capability gap rather than broad sector promotion. In critical minerals, that distinction explains why awards often focus on separation, refining, precursor production, metallization, or magnet manufacturing rather than undifferentiated upstream activity.

    Diagram of how Title III determination and funding mechanisms connect to industrial capacity expansion.
    Diagram of how Title III determination and funding mechanisms connect to industrial capacity expansion.

    How Awards Are Structured

    DPA Title III awards can take several forms. Grants are the most visible. They reduce upfront capital risk and are often used when a facility has strategic importance but uncertain near-term commercial returns. Loans and loan guarantees are another option, particularly where a project has identifiable future cash flow but cannot easily secure private debt on acceptable terms. Purchase commitments can also be used to create demand certainty, which is often as important as capital support in minerals markets with limited domestic offtake depth.

    Direct capital support can have an equity-like effect even when it is not common equity in the corporate sense. The government may fund plant buildout, equipment, or expansion in ways that materially strengthen a project’s financing stack. In many cases, awards are milestone-based rather than fully disbursed at signature. That means engineering, permitting, construction, commissioning, or qualification milestones can determine the release of funds.

    These structures matter because critical minerals projects often fail at the transition between concept, financing, and operational qualification. A Title III award can bridge that gap by combining public capital, signaling strategic priority, and improving a project’s ability to attract complementary private financing.

    Illustration of the industrial processing and separation bottleneck supported by Title III.
    Illustration of the industrial processing and separation bottleneck supported by Title III.

    Why Critical Minerals Fit the Program

    The critical minerals case is driven by concentration risk. For several minerals and processed products, mining may be geographically distributed while refining, separation, or manufacturing remains heavily concentrated in a small number of jurisdictions. That creates exposure not only to trade friction and logistics disruption, but also to technology transfer limits, sanctions risk, export controls, and qualification delays for defense-grade materials.

    Rare earths are the clearest example. The strategic issue is not only ore production. The more sensitive choke points are chemical separation, metal production, alloying, and magnet manufacturing. The same logic applies across battery materials, where precursor and processing stages can be more difficult to localize than mining itself. Title III is so well matched to bottlenecks that are commercially difficult but strategically important.

    What Announced Awards Show

    Public announcements do not provide a full tracker of all DPA activity, and they rarely disclose every contractual term. Even so, they offer a useful picture of policy direction. The Department of Defense has stated that since mid-2023 it awarded a total of $250 million to twelve recipients using Inflation Reduction Act appropriated funds through the DPA Purchases office to support domestic manufacturing capability for strategic and critical materials tied to large-capacity batteries. That indicates breadth across materials and a clear effort to connect defense resilience with industrial capacity relevant to electrification.

    The MP Materials partnership is another widely cited example of Pentagon rare earth investment associated with Title III authorities. Its significance is less about mining alone than about downstream rare earth processing and magnet-related capacity. That is consistent with the broader pattern in U.S. critical minerals funding: the federal government is increasingly focused on the stages that determine whether mined material can actually become qualified domestic supply.

    Milestone-based financing stack concept for how awards are structured.
    Milestone-based financing stack concept for how awards are structured.

    Operational and Compliance Implications

    For supply-chain and institutional analysis, a DPA award is best understood as a capability signal rather than proof of immediate output. Announced support can reduce financing risk, but execution remains exposed to permitting timelines, equipment delivery, technical ramp-up, feedstock availability, and customer qualification. In critical minerals, commercial success also depends on whether the supported facility can integrate with upstream feed sources and downstream buyers in a stable way.

    Compliance considerations are equally important. Projects operating under Title III support may face reporting obligations, domestic sourcing conditions, audit requirements, and other federal oversight mechanisms. Those factors can strengthen traceability and resilience, but they can also lengthen execution timelines relative to purely private projects.

    What to Watch

    The most important signals are not limited to award announcements. Market participants typically watch whether funded projects reach construction and commissioning milestones, whether output qualifies for defense or industrial use, whether additional federal instruments are layered onto the initial award, and whether supported capacity develops durable commercial demand outside direct government backing. Those indicators show whether Title III is merely allocating funds or actually changing the shape of the U.S. critical minerals base.

    The central conclusion is straightforward: DPA Title III critical minerals funding is a targeted industrial expansion mechanism built for strategic bottlenecks. Its role is not to replace markets, but to intervene where markets have left defense-relevant mineral capacity underbuilt. The announced awards suggest a consistent policy logic focused on midstream processing, downstream manufacturing, and reduction of concentrated foreign dependency rather than simple headline support for extraction alone.

  • USGS 2025 Critical Minerals List Update: Copper, Uranium and Metallurgical Coal Added to Federal

    USGS 2025 Critical Minerals List Update: Copper, Uranium and Metallurgical Coal Added to Federal

    The 2025 us critical minerals list marks a substantive policy shift because the U.S. Geological Survey expanded the federal benchmark from the 2022 framework to a 60-mineral list and added materials that reach far beyond the usual battery-metals narrative. The most consequential additions are copper, uranium, and metallurgical coal, which connect the list more directly to grid buildout, nuclear fuel security, steelmaking capacity, and broader industrial resilience.

    According to the USGS final 2025 publication under the Department of the Interior, the updated critical minerals list now includes 60 minerals, including 15 rare earth elements. The final list added boron, copper, lead, metallurgical coal, phosphate, potash, rhenium, silicon, silver, and uranium relative to the 2022 list. That matters because the list is not a general inventory of important commodities; it is the federal reference point used to frame supply-chain vulnerability, research focus, and eligibility across several federal policy pathways.

    Key takeaways

    • USGS published a final 2025 list of 60 critical minerals, expanding the prior 2022 framework and adding 10 minerals.
    • The largest policy signal is the inclusion of copper, uranium, and metallurgical coal, which broadens criticality beyond batteries and rare earths into power, nuclear, and steel supply chains.
    • The methodology centers on supply disruption risk and estimated economic damage, not simply geological scarcity or market visibility.
    • Inclusion can shape federal research, stockpiling, permitting attention, and industrial-policy screening, although it does not create automatic funding or permitting outcomes.
    • Signals to watch include agency implementation, references to the list in grant and procurement frameworks, and how downstream sectors adjust compliance and sourcing narratives.

    What the US critical minerals list is

    The usgs critical minerals list is maintained under the Energy Act of 2020 and updated periodically by USGS. The underlying standard is whether a mineral is essential to the U.S. economy or national security and whether its supply chain is vulnerable to disruption. In practice, that makes the list a federal risk-screening tool rather than a production ranking or trade scoreboard.

    This distinction is important for policy and supply-chain analysis. A mineral can be abundant globally and still qualify as critical if U.S. imports are concentrated, if refining or processing capacity is located in a small number of jurisdictions, or if a disruption would have measurable economic consequences. By the same logic, a commercially important commodity may not qualify if the modeled disruption impact is limited or if substitution and domestic availability reduce systemic exposure.

    Who decides which minerals are critical

    USGS leads the process under the Department of the Interior, with interagency input and public comment informing the final outcome. That structure means the list is partly technical and partly strategic. It incorporates mineral economics and trade exposure, but it also reflects national-security and industrial-policy judgments from agencies with defense, energy, and manufacturing mandates.

    That is visible in the final 2025 outcome. Public reporting and congressional analysis indicate that interagency review influenced the final scope, including additions tied to energy security and defense relevance. As a result, the 2025 list should be read as a cross-government assessment of vulnerability rather than a narrow geoscience exercise.

    Generic supply-chain context for the 2025 critical minerals list.
    Generic supply-chain context for the 2025 critical minerals list.

    How USGS determines criticality

    The updated methodology focuses on the probability and impact of foreign trade disruptions. USGS has described the framework as one that estimates expected economic damage to the United States from supply interruptions and compares those risks in a more quantitative way than earlier versions. Congressional Research Service summaries describe a threshold based on an annualized, probability-weighted net decrease in U.S. GDP.

    In simplified terms, the model weighs several factors: net import reliance, concentration of production and processing, exposure to foreign trade disruption, and the likely effect of a supply interruption on the U.S. economy. The result is a list built around vulnerability and consequence. That helps explain why the 2025 update extends into sectors such as fertilizers, steelmaking, semiconductors, and nuclear fuel, not only electric vehicles or permanent magnets.

    What changed in the 2025 critical minerals list

    The principal change versus the 2022 list is expansion. The final 2025 publication added 10 minerals: boron, copper, lead, metallurgical coal, phosphate, potash, rhenium, silicon, silver, and uranium. The broad direction is clear: federal criticality now covers more of the physical economy, especially materials tied to grid infrastructure, construction, steel, electronics, fertilizers, and power security.

    Explains how USGS translates supply risk into policy criteria.
    Explains how USGS translates supply risk into policy criteria.

    Copper is the most visible addition. Its inclusion aligns the 2025 critical minerals list with electrification and transmission realities, since copper is embedded across grid equipment, motors, industrial wiring, defense systems, and data-center infrastructure. Uranium adds a direct nuclear-fuel dimension and links the list to reactor supply resilience as well as defense-related energy considerations. Metallurgical coal is significant for a different reason: it reflects the continued importance of blast-furnace steelmaking and the industrial dependence on steel inputs across transportation, heavy equipment, and construction supply chains.

    The remaining additions also widen the framework materially. Silicon is central to electronics, solar supply chains, and industrial processing. Phosphate and potash extend criticality into fertilizer inputs and agricultural productivity. Rhenium and silver point to high-performance industrial and electronics uses with potentially concentrated supply chains. Boron and lead broaden the list further into specialty materials and established industrial applications.

    Removals versus additions

    The 2025 update is defined more by additions than by removals. Based on the published final list and summary reporting, the 2022 core remained in place while the final 2025 version expanded the set of covered materials. That signals a broader federal view of mineral vulnerability rather than a narrowing or reprioritization away from earlier critical minerals categories.

    Why the list matters for federal funding pathways

    Inclusion on the us critical minerals list can affect how agencies frame projects and programs across research, demonstration, stockpiling, mapping, recycling, and supply-chain resilience. It can also shape the analytical basis for permitting attention or interagency coordination where statutes and program rules refer to critical minerals. The practical effect is not automatic funding and not automatic regulatory approval. The practical effect is that listed minerals sit inside a recognized federal priority framework.

    Visual emphasis on the newly added minerals (conceptual, non-branded).
    Visual emphasis on the newly added minerals (conceptual, non-branded).

    For supply chains, that matters because federal programs often use official designations as eligibility filters or as part of strategic justification. A broader list so expands the universe of upstream extraction, midstream processing, recycling, substitution, and downstream manufacturing activities that can plausibly be linked to national economic security. Copper’s addition is especially important in this context because it brings a foundational industrial metal inside that policy architecture.

    Operational and compliance implications

    The 2025 list also has compliance and disclosure relevance. Once a mineral is formally designated as critical, companies and public agencies often face greater scrutiny around sourcing concentration, jurisdictional exposure, and processing bottlenecks. That does not create a new legal regime by itself, but it strengthens the policy rationale behind domestic capacity studies, allied-sourcing frameworks, stockpile reviews, and procurement-risk assessments.

    The geopolitical context is equally important. Several listed minerals are characterized by concentrated mining, refining, or conversion capacity outside the United States. The list therefore functions as a public indicator of where trade friction, export restrictions, sanctions exposure, or logistics disruptions could cascade into manufacturing and infrastructure delays.

    Bottom line

    The 2025 US Critical Minerals List Explained in one sentence: USGS has broadened the federal definition of criticality from a narrower strategic-minerals lens to a wider industrial-systems lens. The addition of copper, uranium, and metallurgical coal is the clearest evidence of that shift. For policy watchers and professional market participants, the list is best read as a federal map of supply-chain vulnerability, economic consequence, and future program prioritization grounded in the published USGS framework.

  • Project Vault and the Critical Minerals Paradox: What IT Leaders Need to Do Now

    Project Vault and the Critical Minerals Paradox: What IT Leaders Need to Do Now

    **Project Vault highlights an uncomfortable truth for US business leaders: reducing dependence on Chinese critical minerals may require buying from China first. For CIOs, infrastructure leaders, and procurement teams, the real value is not instant independence but better resilience-more predictable hardware costs, shorter deployment delays, and stronger readiness for regulated and public-sector opportunities.**

    Project Vault and the Critical Minerals Paradox: What It Means for IT Leaders

    Recent policy discussions around Project Vault point to a hard reality that many executives already sense: the US cannot unwind its critical mineral exposure on a political timetable. China still dominates large parts of the mining, refining, and processing chain behind rare earths, graphite, lithium, cobalt, and other inputs that sit inside semiconductors, batteries, cooling systems, and advanced electronics. That creates a paradox. To build a US critical minerals stockpile quickly enough to matter, early purchases may still need to come from Chinese supply chains.

    This means for your business that the near-term goal is not mineral sovereignty. It is continuity. If your company depends on AI infrastructure, data center expansion, battery backup systems, networking gear, or specialized manufacturing equipment, Project Vault matters because it reframes minerals as an operating risk, not just a geopolitical headline.

    The Business Challenge: Critical Minerals Are Now an IT Supply Chain Issue

    For years, many technology leaders treated mineral exposure as someone else’s problem-something for automakers, miners, or defense planners to worry about. That is no longer practical. The components your business relies on every day are built on upstream materials that have become harder to source, harder to price, and harder to replace on short notice.

    The real cost isn’t the technology – it’s the delay. A GPU cluster that ships six months late can derail an AI roadmap. A battery backup project that misses a commissioning window can postpone a data center expansion. A sudden price jump in constrained materials can turn a carefully approved capital plan into an emergency budget discussion.

    Where the exposure shows up

    • Rare earth elements used in magnets for motors, cooling systems, robotics, and manufacturing tools
    • Lithium, cobalt, graphite, and nickel used in batteries, backup power, mobile devices, and energy storage
    • Specialty mineral inputs embedded across semiconductor equipment and advanced electronics production
    • Indirect dependencies that affect server lead times, networking hardware availability, and infrastructure rollout schedules

    Companies like yours typically feel this exposure in three places first: higher procurement volatility, slower deployment cycles, and more pressure from customers or regulators to prove sourcing resilience.

    Why Traditional Responses Fall Short

    Most organizations have already tried some version of the usual playbook: add a second supplier, shift some sourcing outside China, or wait for domestic production to catch up. The problem is that these moves help on paper faster than they help in practice.

    • Tariffs can change pricing, but they do not create processing capacity.
    • Domestic mining projects take years, often longer, to permit and scale.
    • Allied sourcing helps, but available volume is still limited in key categories.
    • Spot-market buying tends to increase risk precisely when supply gets tight.

    That is the central tension in any critical minerals stockpile strategy. The US wants to reduce US-China mineral dependency, but it cannot do that immediately because China remains deeply embedded in the current supply chain. In business terms, this is less like switching office suppliers and more like refinancing a company while the old lender still controls the market.

    Geopolitical supply-chain dependency visualizing the paradox
    Geopolitical supply-chain dependency visualizing the paradox

    Here’s what actually moves the needle: creating buffer capacity, locking in committed supply, and giving non-Chinese processors enough long-term demand to invest. That is the strategic logic behind Project Vault.

    The Modern Solution: What Project Vault Actually Changes

    As described publicly, Project Vault is a multibillion-dollar public-private effort to build a strategic stockpile of critical minerals and signal guaranteed demand to future suppliers. For business leaders, that matters because stockpiles do two things at once. First, they buy time during a supply shock. Second, they make diversification more financially realistic by giving miners, refiners, and processors confidence that demand will still be there when new capacity comes online.

    In plain English, Project Vault is not a shortcut to independence. It is a bridge. And yes, part of that bridge may initially be built with materials sourced from China. That sounds contradictory, but from an operational perspective it is often the only practical path between today’s market structure and a more resilient future state.

    Like maintaining cash reserves during a credit squeeze, a critical minerals stockpile gives buyers options. It can reduce panic buying, smooth procurement cycles, and create more negotiating leverage when export controls or trade tensions tighten the market.

    [BUSINESS_IMPACT]
    Typical Results: Lower exposure to 50%+ price shocks | Lead times reduced from 6-12 months to 3-6 months | Stronger positioning for regulated and defense-adjacent contracts
    Implementation Time: 3-6 months for exposure mapping and pilot sourcing; 12-24 months for broader supplier diversification
    ROI Timeline: 18-36 months in normal conditions; faster if export restrictions tighten
    [/BUSINESS_IMPACT]

    What this changes in practical business terms

    • Cost predictability: less exposure to sudden pricing spikes when supply tightens
    • Faster deployment: better odds of getting constrained hardware on time
    • Risk reduction: fewer emergency purchases, fewer project delays, fewer missed launch windows
    • Strategic positioning: stronger alignment with sourcing expectations emerging in public-sector and defense-adjacent markets
    Impact Area Traditional China-Dependent Model Stockpile-Aligned / Diversified Model
    Lead times for constrained components Often 6-12 months Often 3-6 months with reserved supply
    Hardware cost volatility High exposure to sudden swings More stable through committed contracts and buffers
    Deployment planning Frequent schedule risk Better confidence in rollout timing
    Compliance and contract readiness Reactive sourcing posture Stronger fit for regulated and public-sector bids

    Real Impact: The Numbers Start to Matter Quickly

    In a modeled mid-market scenario, a data center operator spending around $10 million annually on hardware could see total procurement and disruption-related costs fall from roughly $12.5 million to about $10.1 million once buffered sourcing, better supplier commitments, and compliance planning are in place. The savings are not just in lower purchase prices. They come from fewer delays, less downtime exposure, reduced emergency buying, and better contract execution.

    That is the part many leaders miss. Short-term acquisition costs may rise by 10% to 15% when you pay for guaranteed access, qualifying new suppliers, or carrying strategic inventory. But the long-term total cost of ownership often improves because the business stops absorbing hidden costs in the form of missed deadlines, expedited logistics, and interrupted infrastructure programs.

    In our experience with similar companies, the hardest part is not paying the initial premium. It is acting early enough. Once a shortage is visible to everyone, the market has already repriced the risk.

    [KEY_CONSIDERATIONS]
    ✓ Better predictability for semiconductors, servers, batteries, and backup power planning
    ✓ Reduced exposure to export controls, supply delays, and emergency broker pricing
    ⚠ Short-term resilience may still rely on Chinese processing, so continuity improves before independence does
    [/KEY_CONSIDERATIONS]

    The Honest Trade-Off: Resilience Improves Before Sovereignty Does

    Project Vault exposes the hard limits of American mineral sovereignty. Even with political urgency, financing support, and private-sector participation, domestic and allied processing will not scale overnight. That means early stockpile builds may still depend on Chinese inputs, even while the broader strategy is designed to reduce future dependence on China.

    For some executives, that sounds like failure. It is better understood as sequencing. Step one is building a buffer against disruption. Step two is using that buffer to create room for alternative supply chains to mature. If you skip step one, step two becomes harder because the market remains trapped by short-term scarcity and subsidized incumbents.

    IT operational readiness and procurement tracking concept
    IT operational readiness and procurement tracking concept

    What we see in the market is a broader stockpiling race. Governments and large manufacturers are no longer assuming critical materials will be available exactly when needed. They are reserving supply in advance. For technology leaders, that changes procurement from a transactional exercise into a resilience strategy.

    Your Path Forward

    If this issue touches your infrastructure roadmap, the next move does not need to be dramatic. It needs to be disciplined. The organizations that benefit most are usually the ones that treat mineral exposure the same way they treat power availability, cyber risk, or cloud concentration: as a board-level dependency that deserves active management.

    • Map exposure in 30-60 days: identify where critical minerals affect servers, batteries, networking, cooling, and vendor lead times
    • Prioritize high-impact categories in 60-90 days: separate business-critical components from easily replaceable items
    • Pilot resilience measures in 90-180 days: test dual sourcing, reserved inventory, and longer-term supply commitments
    • Integrate sourcing risk into planning within 6-12 months: connect procurement, ERP, infrastructure planning, and finance
    • Scale diversification over 12-24 months: align future buying with domestic and allied supply where volume and economics make sense

    What we’ve learned from enterprise infrastructure planning is simple: the companies that move first rarely do so because they know exactly how policy will unfold. They move because they know delay is expensive. If your business is building AI capacity, modernizing data centers, or competing for regulated contracts, resilience in mineral sourcing is becoming part of the operating model.

    The Bottom Line

    Project Vault is important precisely because it is imperfect. It does not solve US-China mineral dependency overnight. It reveals it. And that clarity is useful. Business leaders do not need a perfect geopolitical outcome to make smarter decisions today. They need a realistic plan to protect budgets, keep deployments on track, and reduce exposure to the next supply shock.

    The companies that win here will not be the ones waiting for full mineral independence. They will be the ones using this transition period to build optionality, improve procurement discipline, and turn supply resilience into a competitive advantage.

  • Securing Defense Supply Chains: Burn-Rate to Resilience

    Securing Defense Supply Chains: Burn-Rate to Resilience

    Securing Defense Supply Chains: From Burn Rates to Business Resilience

    In today’s high-tempo operations, rapid expenditure of advanced munitions can expose hidden vulnerabilities in defense supply chains—delaying replenishment, driving up costs, and threatening mission readiness. For business leaders, the question isn’t only “how many rounds remain.” It’s: which critical materials and suppliers determine whether we can restock under pressure without blowing timelines, budgets, or compliance obligations?

    Executive Summary

    Key Takeaways:

    • Hidden Risk: Rapid munition burn rates shift the bottleneck upstream—from finished inventories to specialty metals and qualified components [1][2]. In business terms: the fastest “consumption rate” can uncover the slowest “replenishment capability,” often outside your direct control.
    • Immediate Action: In 5 days, deploy our Risk Exposure Map template to identify Tier 1–3 dependencies for rare earth magnets, gallium, germanium, tungsten, antimony, and titanium.
    • Next Steps: In 30 days, finalize supplier qualification scorecards and origin-documentation audit reports to close the largest compliance gaps.
    • Long-Term: Integrate physical storage decisions into annual planning to reduce lead-time risk and improve readiness metrics by up to 25%.

    The Business Impact of Critical Metal Shortages

    When high-value systems like Tomahawk cruise missiles or THAAD interceptors are consumed rapidly, restocking isn’t simply a manufacturing question—it’s a risk to operational continuity and contract performance. A single week’s delay in sourcing gallium-based semiconductors can cost up to $2 million in line-downtime and penalties. By proactively mapping exposure to specialty materials, firms can:

    • Reduce unplanned downtime by 15–25%.
    • Cut expedited freight and premium sourcing premiums by 10–20%.
    • Shorten qualification cycles from 90 to 45 days.

    Relatable example: Many organizations plan around demand forecasts, but when a qualified supplier misses a documentation window—or lead times stretch because a metal input is constrained—production schedules effectively become a “negotiation with time.” A risk map turns that uncertainty into a prioritization plan your procurement, finance, and compliance teams can act on together.

    Illustrated supply-chain flow for critical metals into munitions production
    Illustrated supply-chain flow for critical metals into munitions production

    Case Study: Mapping a Munition’s Bill of Materials

    Example: An anti-ship missile includes:

    • NdFeB rare earth magnets (powertrain assembly)
    • Tungsten penetrator core (warhead module)
    • Germanium infrared sensors (guidance electronics)

    Workflow to map Exposure:

    1. Extract BOM from procurement ERP into our Risk Exposure Map template (deliverable #1).
    2. Classify each material to Supplier Tiers 1–3 with fields: supplier name, location, qualification status, lead time, documentation completeness.
    3. Score each entry using our Supplier Qualification Scorecard (deliverable #2) to prioritize remediation.
    4. Output: A decision-ready dashboard indicating “High-Risk” nodes requiring storage, dual sourcing, or expedited qualification.

    Business translation: This approach helps you stop guessing where risk lives. Instead of reacting to delays, you can quantify which dependencies create the biggest schedule and cost exposure—and then fund the right mitigation (inventory, alternate suppliers, or accelerated qualification).

    Burn-rate vs. replenishment capacity over time
    Burn-rate vs. replenishment capacity over time

    Five-Day Blueprint: Rapid Risk Exposure Mapping

    Deliverables:

    • Risk Exposure Map template (Excel/Power BI): pre-built columns for metal type, supplier tier, lead time, documentation status.
    • Quick-start user guide: step-by-step instructions and example entries for a military avionics program.
    • Initial dashboard: graphic heat map highlighting top-5 materials by risk level.

    Why this matters to leaders: In five days, you get a visible, shareable view of risk concentration—so cross-functional stakeholders (programs, procurement, finance, compliance) align on priorities before the next procurement cycle locks in.

    Thirty-Day Deep Dive: Supplier Qualification & Compliance Audit

    Deliverables:

    • Supplier Qualification Scorecard: automated scoring of purity, origin documentation, export-control risk, and audit history.
    • Gap Analysis Report: identifies missing certificates, expirations, and single-source vulnerabilities with cost-impact estimates.
    • Mitigation Plan Outline: recommended dual-sourcing options, expedited qualifier workshops, and storage location assessments to safeguard 90 days of demand.

    Business translation: You’re not just “auditing paperwork.” You’re reducing the likelihood that compliance issues or qualification bottlenecks become the trigger for costly schedule slippage.

    Critical metal inputs for defense industry processing
    Critical metal inputs for defense industry processing

    Building Long-Term Resilience

    Integrate material risk reviews into annual budgeting and strategic planning to:

    • Secure options contracts for critical metals at fixed price tiers.
    • Establish forward-deployed inventory pools near key production sites, reducing lead-time variability by up to 40%.
    • Embed custody and traceability metrics into board-level KPIs to ensure sustained focus on supply-chain health.

    Outcome: Resilience becomes measurable—through readiness metrics, lower volatility in procurement, and fewer surprises that disrupt delivery commitments.

    Calls to Action

    • Schedule a Supply-Chain Risk Workshop: Engage Codolie experts to tailor the 5/30-day templates to your program.
    • Download the Risk Exposure Map starter kit: Instant access to our Excel template and user guide.
    • Contact us for a pilot audit: Validate your top 10 suppliers’ qualification documentation and receive a free gap analysis summary.

    Sources

    1. Le Parisien, “U.S. Tomahawk, JASSM and THAAD Use in Iran War Raises Readiness Questions,” April 24, 2026.
    2. Codolie Proprietary Intelligence, “Defense Critical Metals Supply-Chain Assessment,” May 2026.
    3. Public Domain Data on Critical Minerals and Defense Procurement (no audited stockpile counts publicly available).
  • Securing Your Supply: Business Resilience for Critical Metals

    Securing Your Supply: Business Resilience for Critical Metals


    Securing Your Supply of Critical Metals: A Business Imperative


    Securing Your Supply of Critical Metals: A Business Imperative

    Modern enterprises—from automotive OEMs to data-center operators—depend on a handful of high-value metals and minerals that are increasingly hard to source. When lithium for batteries, copper for power lines, or rare earths for electric-motor magnets become scarce or threaten your cost structure, the impact on revenues and project timelines can be dramatic. In boardrooms worldwide, critical metals have moved from a technical sidebar to a strategic agenda item.

    Why This Matters Now:

    • Electrification, AI infrastructure, and renewable energy rollouts are climbing corporate priority lists.
    • Geopolitical shifts and trade curbs can interrupt refining or processing overnight.
    • Substitute materials often add cost or compromise performance—undermining margins or product quality.

    If you lead procurement, supply chain, or strategy, your next quarterly plan should include a clear stance on critical‐metal resilience.

    Visual primer of key critical minerals and their distinct appearances (no labels).
    Visual primer of key critical minerals and their distinct appearances (no labels).

    1. Defining Success: Business Outcomes Over Commodity Exposure

    “Owning exposure” to a trending metal is not a strategy—it’s a gamble. True success means:

    • Visibility: You can answer within days which metals underlie each product line, service, or project.
    • Continuity: You have multiple sourcing routes or contracts covering >80% of your annual volume.
    • Cost Predictability: Price variance versus budget falls within an acceptable corridor (e.g., ±5%).
    • Strategic Flexibility: You can pivot suppliers or process routes if a single country or plant stops shipping.

    Business leaders at a European EV manufacturer recently mapped their lithium and nickel dependencies within 60 days, negotiated 5-year offtake agreements covering 70% of demand, and reduced single‐country risk from 90% to 30%. Their margin volatility dropped by 12% in the following year.

    2. The Core Metals Map: Aligning Inputs to Business Value

    Not all critical metals behave the same. Align each material to your use case:

    • Lithium & Nickel:
      Use Case: EV batteries, grid storage.
      Business Risk: Price spikes erode product margins; long lead times on new supplier qualifications.
      Typical Mitigation: 3-5 year supply agreements; co-investment in recycling pilots.
    • Copper:
      Use Case: Renewable infrastructure, data centers, charging networks.
      Business Risk: Demand outpaces existing mine and smelter capacity; transport bottlenecks.
      Typical Mitigation: Strategic buffer inventories; regional sourcing partnerships.
    • Rare Earth Elements (REEs):
      Use Case: EV motors, wind-turbine generators, defense electronics.
      Business Risk: Processing dominated by a single country; high geopolitical sensitivity.
      Typical Mitigation: Dual‐sourcing from emerging refiners; investment in alternative magnet designs.
    • Gallium & Germanium:
      Use Case: Semiconductors, telecom equipment.
      Business Risk: Strict export controls; short supply chains.
      Typical Mitigation: Long‐term contracts with guaranteed release clauses; inventory pooling with peers.

    3. Staged Investment: Visibility, Resilience, Optionality

    Building resilience happens in phases:

    • Phase 1 (0–3 months): Visibility
      Map exposures by material, supplier tier, and geography. Produce an executive‐level dashboard of “% revenue at risk” per metal.
    • Phase 2 (3–12 months): Commercial Resilience
      Qualify alternate suppliers, secure multi‐year offtakes, adjust inventory policies, and embed price collars or index-linked pricing.
    • Phase 3 (1–3 years): Strategic Optionality
      Co-invest in secondary supply (recycling/refining), establish regional processing alliances, or negotiate equity stakes in promising projects.

    Case in Point: A multinational utility staged its critical metals budget: 10% on analytics and reporting (Year 1), 50% on contract renegotiation (Years 1–2), and 40% on offtakes and finance structures (Years 2–4). By Year 3, their “price‐shock readiness” improved by 60% against a modelled 15% supply disruption.

    Supply chain structure and bottlenecks visualization.
    Supply chain structure and bottlenecks visualization.

    4. Practical Roadmap & Checklist

    Apply this four‐step checklist to make rapid progress:

    1. Map Entry Points: Identify where each critical metal sits—directly in products or indirectly through suppliers.
    2. Prioritize by Impact: Score metals on substitute difficulty, supply concentration, and revenue at risk.
    3. Redesign Supply Posture: Shift from spot purchases to structured contracts, dual sourcing, and inventory buffers.
    4. Institutionalize Governance: Embed critical‐metal KPIs in executive dashboards—concentration ratios, contract coverage, and time-to-recovery metrics.

    5. Measuring Progress: Key Business Metrics

    Track these KPIs to prove ROI:

    • Single‐Country Dependency (%): Aim for <50% per critical metal.
    • Contract Coverage (%): Target ≥80% of annual volume under fixed or priced agreements.
    • Inventory Days On Hand: Maintain buffer for 4–8 weeks of supply where logistics are fragile.
    • Price Variance vs. Budget: Keep within a ±5% band for each material.
    • Supply Shock Scenario Readiness: Quantify EBITDA impact of a 10–20% shortfall and track improvement over time.

    6. Avoiding Common Pitfalls

    • One-Size-Fits-All Theme: Treat each metal and value chain uniquely.
    • Reserve Announcements vs. Usable Supply: Focus on refining and qualification, not just mine output.
    • Overreliance on Recycling: Important long-term, but limited near-term buffer.
    • Ignoring ESG Risks: Traceability lapses can shut down a supply line despite availability.
    • Delayed Decisions: Slow strategies leave you exposed for years while competitors get ahead.

    7. Call to Action: Executive Next Steps

    Business leaders should treat critical-metal resilience as a standing strategic agenda. Start today by:

    Framework for evaluating geopolitical, operational, and market risks.
    Framework for evaluating geopolitical, operational, and market risks.
    • Commissioning a 30-day exposure audit and executive briefing.
    • Setting a board-level target for contract coverage and country diversification.
    • Engaging with supply-chain specialists to design your bespoke multi-phase investment plan.

    Ready to transform risk into resilience? Contact Codolie’s Critical Metals Practice to schedule a strategy workshop or download our Critical Metals Resilience Toolkit.

  • Securing Rare Earth Supply: Strategic Playbook for Business Leaders

    Securing Rare Earth Supply: Strategic Playbook for Business Leaders


    Securing Rare Earth Supply: Strategic Playbook for Business Leaders

    Why this matters: As electric vehicles, wind turbines, robotics, and defense systems proliferate, securing neodymium, praseodymium, dysprosium, and terbium becomes a board‐level mandate. Price spikes from $80 to $200/kg in under six months (Fastmarkets, 2026) and shifting export quotas (China Mof, 2025) show that supply shocks can erode margins, delay product launches, and trigger stakeholder backlash.

    Executive Summary

    Business leaders face two intertwined risks in rare earths: cost volatility and supply concentration. This guide translates technical points into tangible actions—mapping exposure, structuring contracts, diversifying sources, and building midstream partnerships—to protect EBITDA, preserve launch schedules, and maintain competitive advantage.

    1. Business Objectives: Defining Success

    Your north star is secure access at acceptable cost and acceptable risk. Success for industrial buyers and investors looks like:

    • Production continuity: Zero unplanned shutdowns due to magnet shortages.
    • Margin stability: Reducing input‐cost variance by 50% versus benchmark indices.
    • Negotiation leverage: 10–15% better pricing through multi‐year indexed contracts.

    Example: A European wind‐turbine OEM secured a five‐year NdPr contract with a floor/ceiling pricing formula, cutting cost spikes by 40% in 2026 (internal client data).

    Illustrate the rare-earth refining and separation bottlenecks
    Illustrate the rare-earth refining and separation bottlenecks

    2. Investment Overview: Balancing Cost, Time & Resources

    Building resilience is a multi‐year commitment. Allocate resources across three horizons:

    • Short‐term (0–6 months): Supply‐chain mapping, benchmark subscriptions, and contract review. Estimated budget: $50K–$150K for market intelligence and legal fees.
    • Medium‐term (6–18 months): Dual‐source qualification, test batches, ESG audits, and safety‐stock build‐up. Example investment: $1–2M yields 3–4 months of cover for key magnets.
    • Long‐term (18–60 months): Equity stakes or offtake in separation, recycling, or magnet plants. A 5% stake in a midstream partner can unlock priority allocations and 0.5–1% EBIT uplift annually.

    Industry outlooks project 15% annual growth in magnet demand through 2030 (BloombergNEF, 2024). Yet non‐China capacity remains under 20% of total (Lynas ~10%, MP Materials ramping; industry estimate, 2024).

    3. Implementation Roadmap

    1. Map Exposure: Identify every product and supplier that uses NdPr, Dy, Tb or their alloys. Build a tier‐three supplier register with geographies and lead times.
    2. Build Market Visibility: Track Shanghai Metals Market and Fastmarkets benchmarks, China quota announcements (20–30% swings), and U.S. Defense Logistics stockpile levels.
    3. Create Supply Optionality: Qualify at least two non‐China suppliers for each critical material. Negotiate indexed pricing clauses with caps/floors and allocation rights.
    4. Strengthen Midstream: Partner in separation, recycling, or magnet assembly. Establish memoranda of understanding (MOUs) with timelines and performance milestones.

    Case in point: An automotive OEM reduced project delays by 20% after co‐investing in a U.S. recycling pilot, securing 10% of its 2028 NdPr needs at fixed fees.

    4. Risk Mitigation: Common Pitfalls

    • All rare earths are not the same: Report NdPr, dysprosium, and terbium separately—light vs. heavy elements carry different bottlenecks and price dynamics.
    • Mine capacity ≠ usable supply: Verify separation, alloy, and magnet‐making capacity plus customer qualification status.
    • Overreliance on China: Build regional alternatives in Australia, North America, or Southeast Asia and scenario‐test quota reductions.
    • ESG oversights: Include environmental, social, and waste‐handling diligence—shutdowns often begin with regulatory or community pushback.
    • Average pricing traps: Use trigger‐based governance: NdPr spikes above planning bands or quota cuts should auto‐escalate to finance and procurement heads.

    5. Success Metrics & Dashboard

    Measure leading indicators, not just spend:

    • Supply visibility: % of rare earth exposure mapped through tier‐two and tier‐three suppliers.
    • Diversification: % of NdPr, Dy, Tb from qualified non‐China sources.
    • Inventory resilience: Months of cover for magnet‐critical materials.
    • Contract quality: % of spend under multi‐year agreements with clear pricing formulas and force majeure terms.
    • Lead‐time stability: Variance in magnet/component lead times versus plan.
    • ESG traceability: Audit completion rate and remediation actions.
    • Circularity: Recycled or recovered material share.

    Example dashboard trigger: NdPr > $160/kg for 10 consecutive days → invokes emergency procurement review.

    6. Partner Selection: Criteria for Success

    • End-to-end expertise: From ore to magnet, with deep understanding of bottlenecks at each step.
    • Market intelligence: Real-time tracking of pricing, quotas, ramp-ups, and demand proxies like EV production.
    • Commercial structuring: Proven offtake agreements, indexed pricing, inventory strategies, and supplier‐qualification support.
    • ESG & regulatory competence: Expertise in radioactive residue, permitting, and traceability requirements.
    • Global reach: Regional insight across China, Australia, Southeast Asia, North America, and Europe.
    • Board-level communication: Translating complexity into actionable capital allocation and risk‐management decisions.

    Red flag: Advisors promising a “quick exit” from China or treating mine ownership as a complete strategy.

    Communicate concentration risk and price volatility signals
    Communicate concentration risk and price volatility signals

    Conclusion & Next Steps

    Rare earth materials are strategically valuable because separation, refining, and magnet production remain concentrated and complex. Business leaders win by treating rare earths as a continuity‐of‐supply ecosystem, not a simple commodity play. Prioritize visibility, diversify suppliers, structure robust contracts, invest in midstream optionality, and monitor triggers to act before shortages hit the P&L.

    Schedule a Board-Level Briefing or Download Our Supply Chain Risk Checklist to kick-start your resilience program today.